
Competitor Hashtag Analysis for Instagram
Stop copying random tags; track repeat competitor hashtag patterns tied to saves, shares, and views to improve organic reach.
Stop copying random tags; track repeat competitor hashtag patterns tied to saves, shares, and views to improve organic reach.
4.98 /5 - from 58k reviews
Trusted by 50,000+ creators — get real engagement delivered to your profile in minutes, not days.

Instagram now caps posts at five hashtags, and hashtag reach depends more on post performance than tag volume. So if I want better organic growth, I should stop copying random tags and start tracking repeat patterns across competitor posts.
Here’s the short version:
A few numbers matter here. The article notes that saves can drive 4x more downstream timeline reach than likes, Instagram shifted toward Views as a main visibility metric in April 2025, and engagement dropped 16% year over year in 2025. That means old hashtag habits can lose steam fast.
If I had to sum it up in one line: the goal is not to copy competitors, but to find repeat hashtag patterns tied to stronger reach and engagement, then test the parts that fit my account.
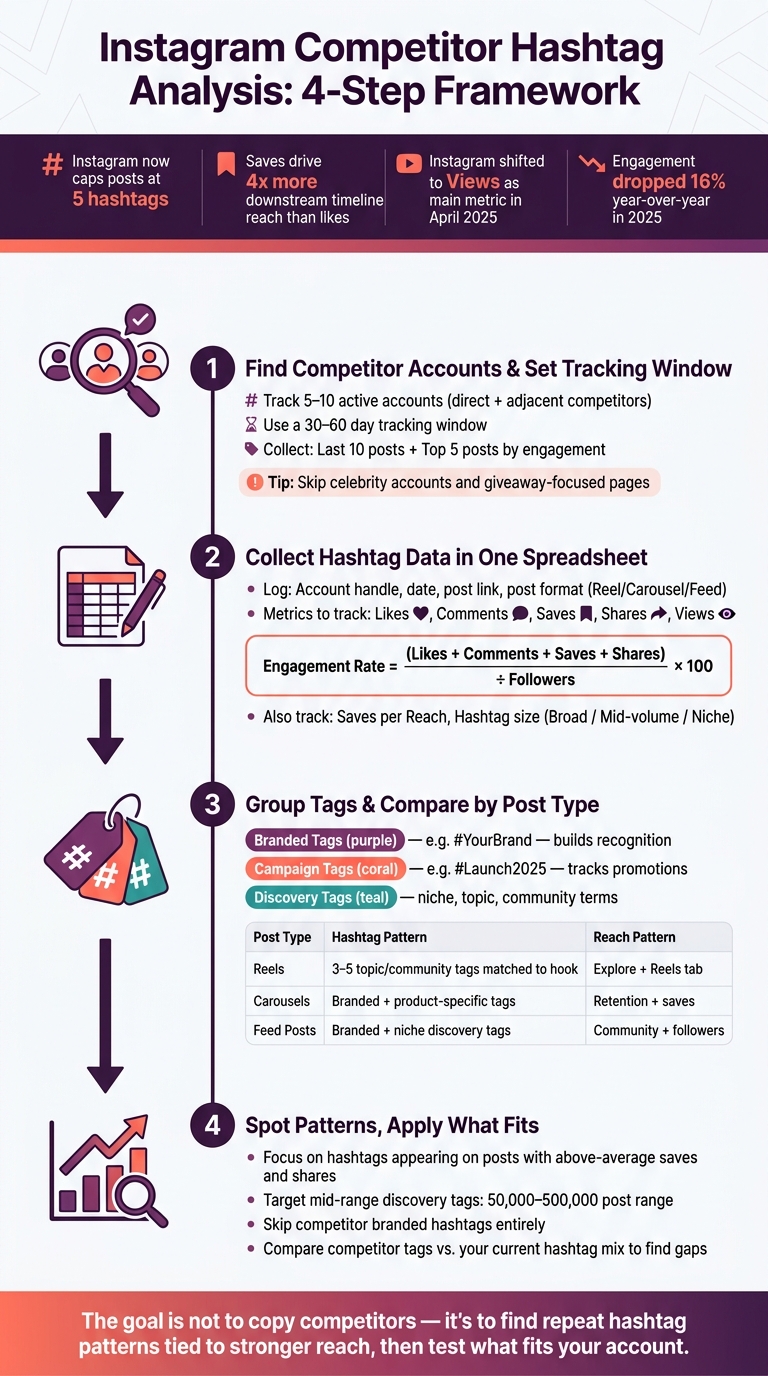
Instagram Competitor Hashtag Analysis: 4-Step Framework
Now that your baseline metrics are set, trim your list down to accounts that can show useful hashtag patterns.
Start with 5–10 active accounts. Put direct competitors first, then add adjacent competitors if you want a broader view of the audience. It also helps to keep follower counts in a similar range so the comparison stays fair.
A simple way to find these accounts is to search niche hashtags, keywords, and location tags. That matters even more in local markets, where audience overlap tends to show up fast. From there, keep only accounts that match your topic and speak to a similar audience. If an account is inactive, off-topic, or aimed at a different crowd, cut it.
Skip big creator or celebrity accounts. Their reach often comes from name recognition or sheer size, not from hashtag choices. So if you copy their tags, you probably won't get the same result as a smaller or niche brand. It's also smart to leave out accounts built around giveaways, meme content, or unrelated topics, since they can throw off your sample.
Once your list is locked in, the next step is to pull enough posts to spot patterns that show up more than once.
Use the same 30–60 day window across all competitors so you're comparing like with like. For each account, collect:
This side-by-side view helps you see whether a hashtag shows up again and again or only appeared on one high-performing post.
If you're trying to spot evergreen tags, stretch the window to 60–90 days. That makes it easier to separate repeat hashtags from one-off campaign tags.
| Analysis Component | Recommended Size/Range | Purpose |
|---|---|---|
| Competitor List | 5–10 active accounts | Balanced data signal |
| Tracking Window | 30–60 days | Captures current patterns |
| Post Sample | Last 10 posts + Top 5 posts by engagement | Compares recent vs. peak performance |
| Hashtag Count Used | Record the actual number of hashtags per post | Shows whether competitors stay consistent |
After that, log each post's hashtags and performance in one sheet.
Use the same tracking window from Step 1 and log every post in a single spreadsheet. The goal is simple: put hashtags, reach, engagement, and follower growth side by side so you can spot patterns fast.
For each post, record the account handle, date, direct link, and post format - Reel, Carousel, or photo post. Then add the full hashtag list. For engagement, log likes, comments, saves, and shares. You should also add a Views column, since Instagram shifted its main visibility metric from impressions to Views in April 2025.
Add an Engagement Rate column using this formula: (likes + comments + saves + shares) ÷ followers × 100. This helps you compare accounts on equal footing, even when their follower counts are far apart.
If reach data is available, track Saves per Reach too. That gives you another quality signal, especially because saves are a strong signal for the Instagram recommendation algorithm in 2026.
| Field Category | Columns to Include |
|---|---|
| Post Info | Account Handle, Date, Post Link, Post Format |
| Hashtag Info | Full Hashtag List, Repeated Tags |
| Engagement | Likes, Comments, Shares, Saves |
| Performance | Views, Engagement Rate %, Saves per Reach |
After you log a few posts, start marking hashtags that appear more than once across a competitor's content. Repeated tags often point to core branded or discovery buckets.
Frequency is only part of the picture. You should also label each hashtag by size category: broad (high volume, high competition), mid-volume, or niche (specific, more targeted). Broad tags can bring more noise. Niche tags often pull in a tighter audience.
Once those labels are in your sheet, Step 3 gets much easier. You can group tags by post type and compare what tends to work for Reels, Carousels, and photo posts without digging through a mess of raw data.
If manual logging starts to drag, a dashboard can make life easier. UpGrow offers a real-time live dashboard that speeds up metric collection and keeps your performance data in one place.
Once your posts are logged, group hashtags by job and compare them across post formats.
At this stage, stop treating hashtags like one long list. It helps to sort them into categories. Most competitor hashtags will fit into three buckets, and each bucket tells you something different about how they post.
Branded tags are tied to the business or creator itself, like #SkedSocial. Brands use them to build recognition and track UGC.
Campaign tags connect to a launch, promotion, or ad push, such as #Stockholm2025. These tags help drive attention around one specific push and track how it performs as it happens.
Discovery tags cover broad industry terms, niche community tags, and topic or product tags.
In your spreadsheet, add a Tag Group column and label each hashtag as Branded, Campaign, or Discovery. Then compare each group against reach, likes, comments, saves, shares, and follower growth. The goal is simple: spot which tag group shows up most often on posts that perform better.
Different post formats usually use hashtags in different ways. Reels tend to do best when the hashtags match the hook, audio, and on-screen text. If those pieces don’t line up, reach can drop. Carousels often blend branded tags with product-specific tags, while feed posts usually mix branded tags with niche discovery and topic tags.
Use the same labels to see how hashtag patterns change by post type:
| Post Type | Hashtag Pattern | Typical Reach Pattern |
|---|---|---|
| Reels | 3–5 specific topic and community tags matched to the hook, audio, and on-screen text | Viral discovery via Explore and the Reels tab |
| Carousels | Mix of branded and product/service-specific tags | Retention and saves |
| Feed Posts | Mix of branded, niche discovery, and topic tags | Community and followers |
If a competitor uses 20+ hashtags, treat that as an outlier, not a template.
Once you've grouped hashtags by type and format, sort them by performance.
Focus on the hashtags that keep showing up on posts with above-average likes, comments, saves, and shares. Two tiebreaker metrics help a lot here: saves per reach and shares per reach. If the same hashtag set appears again and again on posts where those numbers are strong, pay attention. Those are your main quality signals because they point to better reach signals.
It also helps to mark tags that show up often but don't seem to move any metric. Broad tags may bring more reach, but they often pull in low-intent traffic. What matters is relevance, not volume.
After you know which tags repeat, stack them against your current hashtag mix. This usually shows three things fast:
Give extra attention to mid-range discovery tags in the 50,000–500,000 post range. That's often where the best test ideas show up. If competitors are using niche-specific tags in that range and also getting strong saves and follower growth, that's a good sign those terms are worth trying in your own posts.
Skip competitors' branded hashtags entirely. Using a rival's branded tag doesn't help discovery. It just sends traffic their way.
Run this audit on a set schedule so your hashtag mix stays current. Instagram engagement dropped 16% year-over-year in 2025, so a set that worked last quarter may already be losing steam.
The point isn't to copy competitors. It's to see what's working in your niche right now, then use the parts that fit your content, audience, and brand voice.
Run a formal hashtag audit at least once a month to keep your strategy effective and competitive. That gives you a regular check-in point to remove tags that aren't pulling their weight and bring in new ones based on current performance and platform trends.
It also makes sense to repeat the analysis before major campaign launches or seasonal pushes. If your niche changes fast, weekly audits can help you spot new synonyms and shifts in the way people talk.
Avoid:
Start with hashtags that line up with your main content pillars and the phrases your audience is already searching for. It also helps to check competitor posts and spot the tags that show up on high-engagement content. Just don’t copy branded hashtags.
A good rule of thumb is to focus on hashtags with 10,000–200,000 posts. For each post, use 3–5 hashtags and mix broader terms with more niche ones. Then track performance in a spreadsheet so you can see what’s pulling its weight.
Swap out about 20%–30% of your hashtags on a regular basis. That gives you room to test new options without giving up the tags that already work.


