Table of contents
- How to Make an Instagram Story Poll Template in Canva (Get More Engagement Fast)
- How to Choose a Story Template That Fits Your Poll
- How to Design a Poll That Is Easy to Read and Tap
- When to Post and Who to Target With Your Poll Stories
- How to Track Taps, Exits, and Poll Responses to Improve Your Next Template
- Conclusion: Build, Post, Measure, and Repeat
- FAQs
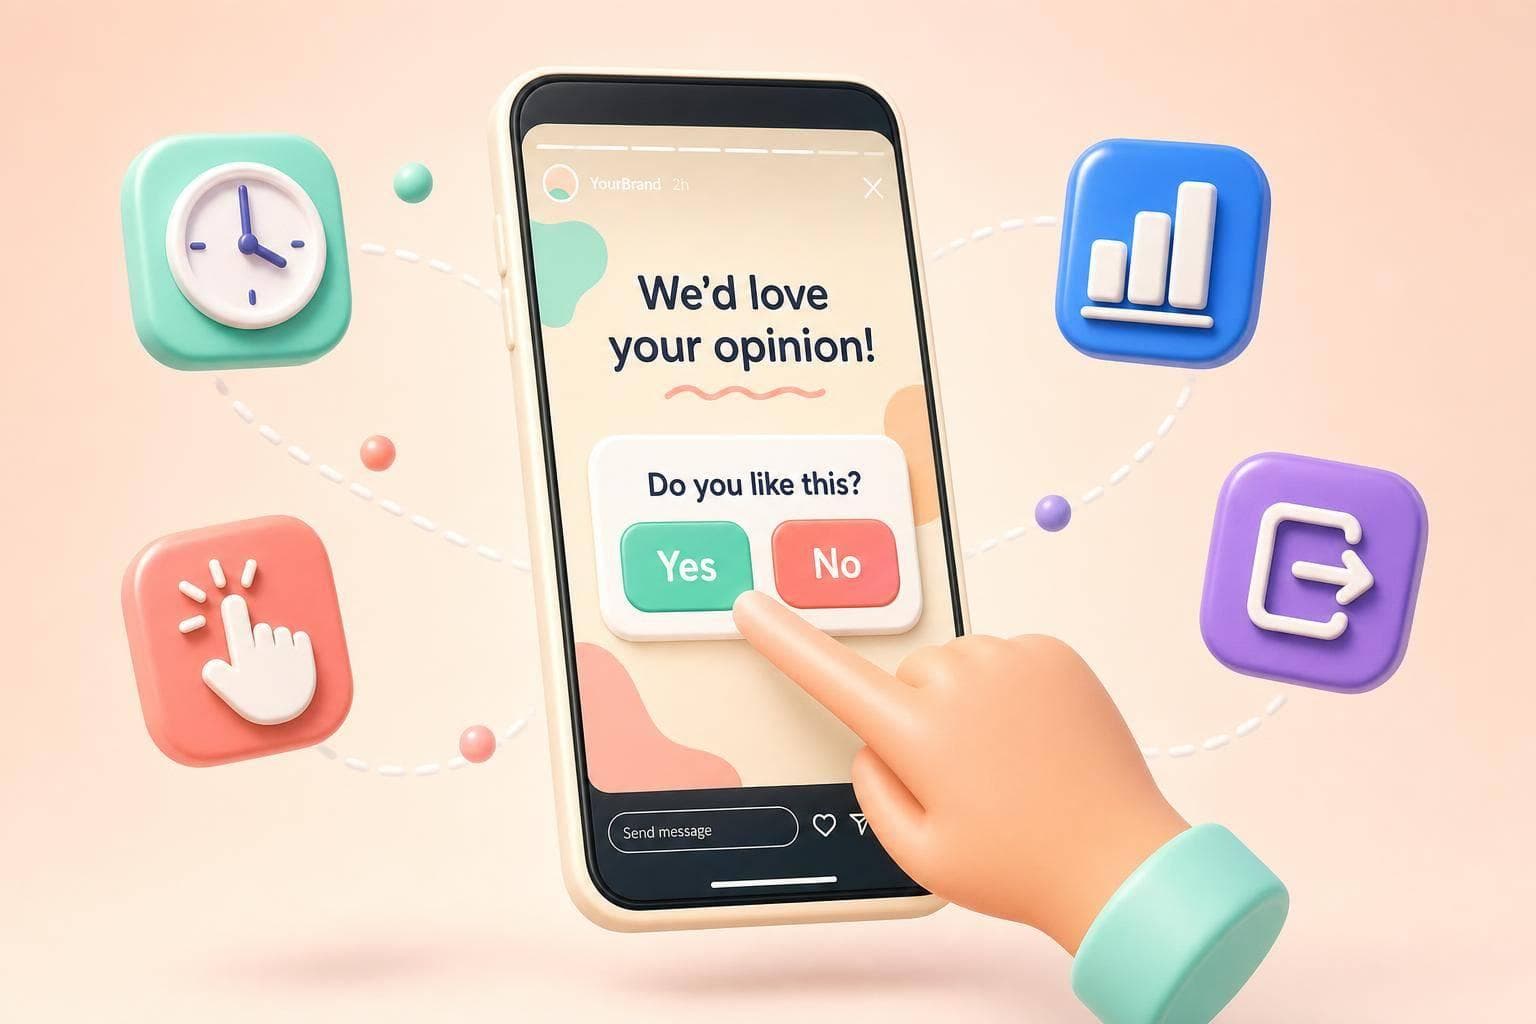
Most Instagram Story polls fail for simple reasons: the slide is hard to scan, the sticker is placed badly, or the poll shows up too late. I’d fix that with a repeatable setup: pick one goal, use a clean template, place the poll near the center or lower third, post when followers are active, and track votes, exits, and taps forward.
Here’s the short version:
- Use one poll for one job: product feedback, content interest, event choices, or customer needs
- Keep the slide simple: short prompt, open space, clear sticker placement
- Write the full question in text and keep poll answers short like Yes / No or A / B
- Post the poll early in the Story sequence, since drop-off is often highest on the first frame at about 23.8%
- Use Insights to check active hours and compare poll response rates over time
- Measure with a simple formula: votes ÷ impressions × 100
- Change one thing at a time so you know what improved results
A good poll template saves time, keeps your Story style steady, and makes testing much easier. If I wanted more taps, I’d focus less on decoration and more on clarity, timing, and clean placement.
That’s the whole playbook: build, post, measure, repeat.
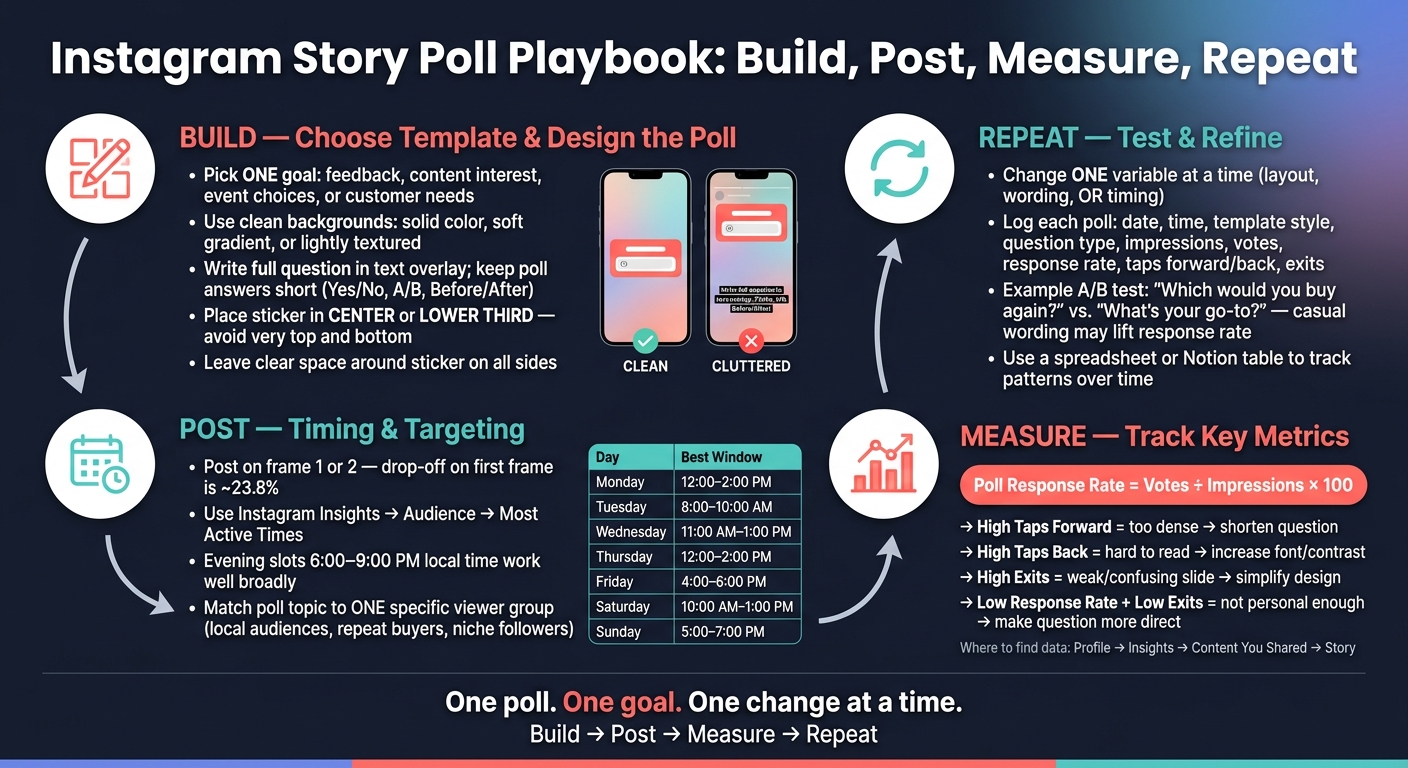
Instagram Story Poll Playbook: Build, Post, Measure, Repeat
How to Make an Instagram Story Poll Template in Canva (Get More Engagement Fast)
sbb-itb-3c55afb
How to Choose a Story Template That Fits Your Poll
Pick a layout that makes the poll easy to spot and tap right away. Something can look polished in a design tool and still flop on a phone if the poll sticker gets lost under too many visuals.
Use Clean Layouts With Space for the Poll Sticker
Solid-color backgrounds, soft gradients, and lightly textured images usually work better than busy photos or stacked graphics. Why? They give the poll sticker room to stand out instead of fighting for attention.
Keep each slide simple: a short headline and the poll sticker. That’s usually enough. Every extra icon, image, or text block pulls the eye away from the answer choices. Before you post, preview the Story at actual phone size and check that the question and both poll options are easy to read without zooming.
Place the sticker and the main text near the center of the screen. Stay away from the very top and bottom, where app controls and thumbs can get in the way of taps. That choice makes the poll easier to read and easier to use.
Match the Template to the Question Type
The layout should match the kind of question you’re asking. A Instagram polls and questions usually needs a plain background, a short prompt, and the sticker. A product preference question tends to work better with a split-screen layout that separates each option clearly, with the poll sticker centered on the dividing line.
| Question Type | Template Style | Example Question |
|---|---|---|
| Yes / No | Minimal, single background, short prompt | Do you want part 2 tomorrow? |
| Product preference | Split-screen or product-shot layout | Which launch color should we post next? |
| Audience opinion | Neutral branded frame, text-first | Which design do you like more? |
| Feedback / satisfaction | Clean, low-friction, conversational feel | Was this tip helpful? |
Next, shape the question, answer choices, and sticker placement for fast interaction.
How to Design a Poll That Is Easy to Read and Tap
Good poll design cuts friction. The goal is simple: make the question fast to read and the answer fast to tap. A solid Story layout should make the poll clear in one glance.
Write the Question in the Text Overlay and Keep Answers Short
Put the full question in the text overlay. Then keep the sticker answers short, like Yes / No, Before / After, or Option A / Option B.
This works because people can read the setup first, then tap without thinking too hard. Keep both answers in the same style and length when you can. If one label is longer or more detailed than the other, people pause. And that pause can cost you taps.
Place the Sticker in the Center or Lower Third
Place the sticker in the center or lower third so it's easy to tap. Keep it above the bottom UI so people don't accidentally exit the Story instead.
A good rule of thumb: leave space around the sticker on all sides. Also, don't drop it on top of faces or other key parts of the image. If the poll fights with the visual, the visual usually wins.
Clean vs. Busy Poll Layouts: A Side-by-Side Comparison
Your background choice can push people to tap or scroll past. Here's how a few common layouts tend to perform:
| Layout Type | Readability | Ease of Tapping | Likely Effect on Poll Responses |
|---|---|---|---|
| High-contrast minimal background + centered sticker | Very high - text and sticker stand out clearly on mobile | Easy - poll is visible and unobstructed | Stronger; viewers understand and tap quickly |
| Image-heavy background + bottom-aligned sticker | Lower - busy visuals compete with text and sticker | Error-prone, especially near Story controls | Weaker, with more taps forward or exits |
| Busy background + centered sticker | Moderate - center placement helps, but clutter still competes | Better than bottom placement, but depends on spacing | Mixed; depends on whether the visual context supports the question |
Busy layouts can still work if the image adds context, like a before-and-after comparison. In that case, carve out a high-contrast area for the poll. An easy fix is to place a solid or semi-transparent overlay behind the question text and sticker.
Also, keep GIFs, emojis, and tags far from the poll. If the tap area looks crowded, people hesitate or hit the wrong thing. Once the layout is clear, post it at the best time to post on Instagram when your followers are most active.
When to Post and Who to Target With Your Poll Stories
Once your template is easy to read, timing and targeting play a big role in who actually taps it.
Post When Your Followers Are Most Active
Timing matters. Even a strong poll can flop if your followers aren't online.
Use Instagram Insights to find your best posting window. Switch to a Business or Creator account, then go to Insights → Audience → Most Active Times. Check both the Hours and Days views to see when your audience is online. When you schedule posts, use your audience's local time zone.
These U.S. time slots are a good place to start.
| Day | Strong Posting Window |
|---|---|
| Monday | 12:00–2:00 PM |
| Tuesday | 8:00–10:00 AM |
| Wednesday | 11:00 AM–1:00 PM |
| Thursday | 12:00–2:00 PM |
| Friday | 4:00–6:00 PM |
| Saturday | 10:00 AM–1:00 PM |
| Sunday | 5:00–7:00 PM |
Evening slots - about 6:00–9:00 PM local time - also tend to work well for many audiences, especially people scrolling after work or while relaxing at home. If you're not sure which window fits best, test a few over several weeks and compare response rates.
Of course, timing alone won't save the poll if people never reach it. Most viewers drop off after the first frame. So keep the sequence short, and put the poll on frame 1 or 2.
Match Poll Topics to a Specific Viewer Group
After timing, tighten the topic around one viewer group.
A poll aimed at everyone usually feels flat. It's better to match each poll to one group, like local audiences, repeat buyers, or niche followers. For example, a local restaurant asking which seasonal special to bring back will get more useful replies than a broad, open-ended prompt. A fitness brand talking to returning customers might ask about favorite class times or workout formats.
Different groups respond to different angles:
- Local audiences often react well to location-based choices and event picks
- Repeat buyers tend to engage more with product variants or restock questions
- Niche communities usually tap more on opinion polls or choose-your-favorite prompts
Write each poll for one group, not for everyone.
How to Track Taps, Exits, and Poll Responses to Improve Your Next Template
What Taps Forward, Taps Back, Exits, and Response Rate Tell You
Once your Story is live, the next step is simple: check if the template was easy to move through. In Instagram, go to Profile → Insights → Content You Shared → Story. There, you can see impressions, taps forward, taps back, exits, and votes.
Each metric gives you a clue.
Taps forward usually mean people skipped that frame. So if your poll slide gets a lot of forward taps, the question may be too long, or the layout may feel too busy to scan in a second or two.
Taps back can mean one of two things. People may be interested enough to look again, or the text may not be clear on the first pass.
Exits matter most. If someone exits on your poll frame, they left Stories altogether. Exit rates often jump on weak or confusing slides, and the biggest drop-off usually happens on the first frame at around 23.8%.
To calculate your poll response rate, use:
poll votes ÷ impressions × 100
If that number goes up over time, your template and your question are likely getting sharper. The best move is to track your own baseline and compare poll results against it.
Use what you see to guide the next version of your template.
| Metric | What It Suggests | What to Try Next |
|---|---|---|
| High taps forward | Too dense | Shorten the question, simplify the layout |
| High taps back | Readable but small | Increase font size, improve contrast |
| High exits | Relevant but weak | Simplify the design and test posting at a more active time |
| Low response rate, low exits | Viewed, not tapped | Make the question more personal or direct |
Use Response Patterns to Improve Future Stories
Track each poll in a simple log so you can compare templates over time. A spreadsheet or a Notion table works well. For each poll Story, record the date and time posted, the day of the week, template style, question type, impressions, votes, response rate, taps forward, taps back, and exits. For example: 08/16/2026, 7:30 PM PT. After you log enough entries, patterns start to show up, helping you use Instagram analytics to improve your strategy.
The main rule here is test one variable at a time.
If you change the background, the question wording, and the posting time all at once, you won't know what caused the result. A cleaner way to test is to run the same poll on two separate occasions and change only one thing, like the phrasing.
Say you switch from "Which would you buy again?" to "What's your go-to?" and that change lifts response rate while cutting forward taps. That tells you something useful right away: your audience may react better to casual wording than to more formal language.
Conclusion: Build, Post, Measure, and Repeat
Poll Stories work best when you treat them like a loop: goal, template, timing, and review. Start with the goal. That should shape the question, the layout, and when you post. When those parts line up, each poll turns into a quick test you can run again and again.
Use a clean template with open space in the center or lower third for the poll sticker. The prompt should make sense at a glance and invite a single tap. Keep the answer choices short. Post when your followers are most active, and match the topic to the moment: broad topics for peak times, niche topics for your most engaged followers.
Once the Story has enough views, check taps forward, taps back, exits, and response rate. High forward taps usually point to weak framing. High exits often mean clutter or a mismatch between the topic and the audience. Compare each result with your recent polls, then change one thing at a time - layout, wording, or timing - so you can see what improved performance. Build, post, measure, and refine the next Story.
FAQs
How often should I post poll Stories?
Aim to post 3 to 7 Stories a day to keep engagement steady. What matters most is consistency, not sheer volume. When you post on a regular rhythm, you’re more likely to stay visible in followers’ Story bars.
If you want better poll results, post during peak activity windows like 11:30 AM–1:30 PM or 9:00 PM–11:00 PM. It also helps to stick to a repeatable daily schedule instead of posting at random.
What is a good poll response rate on Instagram Stories?
There’s no single benchmark for Instagram Story poll response rates. That said, overall Story engagement often lands between 3% and 6%.
To figure out your poll response rate, divide total votes by Story reach.
Then look at your last 30 days of data to set your own baseline. From there, watch how the numbers change as you learn which topics get the most response from your audience.
Should I use polls on the first Story slide?
Usually, no. In a multi-slide Story sequence, polls often work better in the middle. That placement can help hold attention and keep more people watching.
Here’s why: completion rate compares the reach of your last slide to the reach of your first slide. So if you place the poll later, more viewers may stick with the full sequence before they interact.
If your first slide tends to lose viewers, lead with a bold visual or a teaser headline first.