
90+ Instagram Engagement Rate Statistics for 2026 (Benchmarks by Industry, Follower Size & Format)
Engagement on Instagram dropped in 2026; benchmark performance varies by industry, follower size, format, and calculation method.
Engagement on Instagram dropped in 2026; benchmark performance varies by industry, follower size, format, and calculation method.
4.98 /5 - from 58k reviews
Trusted by 50,000+ creators — get real engagement delivered to your profile in minutes, not days.

Instagram engagement is down in 2026, and most accounts now sit around 0.5% to 1.2% depending on how the rate is measured. If I want to judge an account the right way, I can’t stop at the platform average. I need to compare industry, follower size, post format, and calculation method.
Here’s the short version:
A few things stand out right away. First, small accounts usually get higher engagement than large ones. Second, carousels and Reels beat single-image posts in most cases. Third, the gap between studies is often about how engagement is calculated, not bad data.
| Area | What the article shows |
|---|---|
| Platform average | 0.36% to 4.3% across studies, based on method and account type |
| Good benchmark | 1%+ is strong for many brand accounts |
| Industry leader | Higher Education: 2.43% |
| Small-account edge | Nano influencers lead by a wide margin |
| Best format | Carousels for engagement, Reels for reach |
| Main shift in 2026 | Private actions like saves and shares matter more than likes |
If I’m checking whether an Instagram account is doing well in 2026, the main takeaway is simple: don’t compare everything to one average number, but focus on how to increase Instagram engagement through tailored strategies. Compare like with like, use the same formula, and look past likes alone.
Instagram Engagement Rate Benchmarks 2026: By Industry, Follower Size & Format
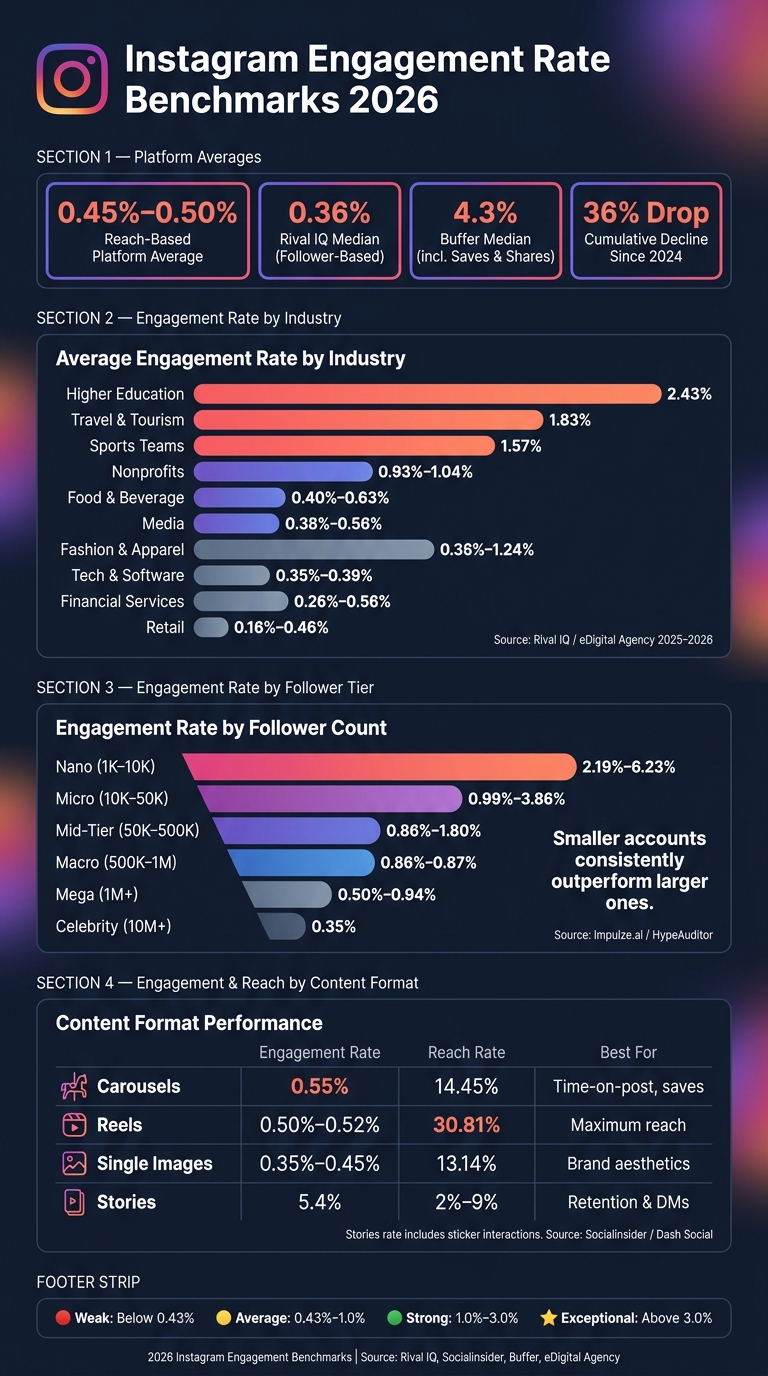
The average Instagram engagement rate in 2026 sits around 0.45%–0.50% on a reach-based basis. But published studies land anywhere from 0.36% to 4.3% depending on how they calculate the metric. So this number works best as a baseline, not a final judgment.
That spread doesn't mean the data conflicts. It mostly comes down to measurement. Different studies use different denominators and different definitions of engagement, so the results can vary a lot.
| Study Source (2025–2026) | Reported Average/Median | Calculation Method |
|---|---|---|
| Socialinsider | 0.45%–0.50% | Engagement by reach |
| Rival IQ | 0.36% (median) | Engagement by followers |
| eDigital Agency | 1.22% | Engagement by followers (active creator accounts) |
| Statista | 1.59% | Influencer average |
| Buffer | 4.3% (median) | Engagement by followers, including saves and shares |
Once you line these studies up, the pattern gets pretty clear: brands and creators don't perform the same way. Creator accounts tend to post higher engagement than brand accounts, which pushes creator-heavy studies up.
The biggest factor is the denominator. If you divide interactions by followers (using a likes-to-followers ratio calculator), reach, or impressions, you'll get different answers from the same post.
The definition of an interaction also changes the result. Some studies count only likes and comments. Others include saves and shares too. That's why Buffer reports medians as high as 4.3%, while other studies show much lower figures.
Account mix matters too. A platform-wide brand study and a creator-focused dataset are not measuring the same group. So Rival IQ's 0.36% median and creator-led studies with higher averages can both be correct at the same time. They're just looking at different populations.
Socialinsider says average engagement fell from about 0.70% in early 2024 to 0.45%–0.50% in early 2026. That adds up to a cumulative drop of about 36% over two years.
One major study also found a 28% year-over-year decline from 2024 to 2025, which was the steepest single-year drop on record.
That means today's benchmark is lower than it was in 2024, and that's a big part of the story. If an account looks weaker on paper, it may still be doing fine once you compare it against the right context: its industry, follower size, and content format.
A good Instagram engagement rate in 2026 depends on who you're comparing yourself to. Looking at the platform average alone won't tell you much. A better approach is to compare your account with similar accounts in your size range. You can even compare Instagram influencers side-by-side to see how your metrics stack up against competitors.
According to Rival IQ, 1%+ engagement rate is generally considered good and usually puts a brand account in the top quartile. Use the ranges below as a starting point by follower count, then stack that against the industry and content-format benchmarks later in the article.
Rival IQ (2026) says that 1%+ is generally considered good. A rate between 1% and 3% signals top-tier performance for most industries . If you're below 0.43%, it's time to optimize your content. Anything above 3% is rare and tends to show up more often in niche communities and top nano accounts .
| Classification | Typical Rate | What It Means |
|---|---|---|
| Weak | Below 0.43% | Below the platform median; review content mix |
| Average | 0.43% – 1.0% | Near the platform median for most brand accounts |
| Strong | 1.0% – 3.0% | Top-tier performance for most industries |
| Exceptional | Above 3.0% | Common in niche communities and top nano accounts |
One thing trips people up all the time: not all engagement benchmarks measure the same thing. Follower-based benchmarks, reach-based benchmarks, and different engagement definitions can lead to very different numbers. If you mix them, you're comparing apples to oranges.
Once you know what range you're aiming for, the next move is picking the right formula.
Use the formula that lines up with the benchmark you're using.
| Method | Formula | Best Use Case |
|---|---|---|
| By Followers | (Total Engagements ÷ Total Followers) × 100 | Competitive benchmarking against similar accounts |
| By Reach | (Total Engagements ÷ Total Reach) × 100 | Measuring how well content resonates with actual viewers |
| By Impressions | (Total Engagements ÷ Total Impressions) × 100 | Evaluating repeat engagement power, especially for ads |
Use engagement by followers when you want to compare your account with another account or with an industry benchmark table. Use engagement by reach when you want a cleaner read on how your content performed with the people who actually saw it. And if you're just trying to check the math without pulling out a calculator, the Instagram engagement rate calculator does it for you.
"A 5% engagement rate means something very different for an account with 500 followers compared to one with half a million." - Tamilore Oladipo, Sr. Content Creator, Buffer
Even good content can show a lower engagement rate if your follower base includes lots of inactive or off-target accounts. Ghost followers - users who never interact - make the denominator bigger without adding any engagement. That drags down the rate, even when the content itself is doing fine.
That's why two accounts with the same follower count can end up in very different spots.
In 2026, follower quality matters even more because Instagram is putting more weight on saves and shares than on public likes . Real, active followers are much more likely to save and share your posts, which helps your engagement rate stay strong over time.
The ranges below give you a practical baseline to compare your numbers against. And each figure comes from a named source, so you can see exactly what it refers to.
According to Rival IQ, Higher Education tops this group at 2.43% engagement. Think of the table below as your 2026 industry baseline.
| Industry | Avg. Engagement Rate | Source & Year | Notes |
|---|---|---|---|
| Higher Education | 2.43% | Rival IQ | Follower-based median |
| Travel & Tourism | 1.83% | eDigital Agency | Visual-first content |
| Sports Teams | 1.57% | Rival IQ | Fan-driven content |
| Nonprofits | 0.93%–1.04% | Rival IQ / Colorlib | Mission-driven content |
| Food & Beverage | 0.40%–0.63% | Rival IQ / Colorlib | High shareability |
| Media | 0.38%–0.56% | Rival IQ / Colorlib | Frequent posting |
| Fashion & Apparel | 0.36%–1.24% | Rival IQ / eDigital | Saturated market |
| Tech & Software | 0.35%–0.39% | Rival IQ | B2B content |
| Financial Services | 0.26%–0.56% | Rival IQ | Utility focus |
| Retail | 0.16%–0.46% | Rival IQ | Transactional |
If your industry lands near the bottom of this table, context matters a lot. A rate around 0.40% may be competitive in Financial Services or Retail, but it would sit well below the mark in Higher Education .
Follower count changes the picture too.
According to Impulze.ai and Stack Influence data, nano-influencers with 1K–10K followers average between 2.19% and 6.23% engagement. At the other end, mega accounts with 1M+ followers often fall between 0.50% and 0.94%.
| Follower Tier | Follower Range | Avg. Engagement Rate | Source & Year | Account Type |
|---|---|---|---|---|
| Nano | 1K–10K | 2.19%–6.23% | Impulze.ai / Stack Influence | Influencer |
| Micro | 10K–50K | 0.99%–3.86% | Impulze.ai / Stack Influence | Influencer |
| Mid-Tier | 50K–500K | 0.86%–1.80% | Impulze.ai | Influencer |
| Macro | 500K–1M | 0.86%–0.87% | Colorlib / Impulze.ai | Influencer |
| Mega | 1M+ | 0.50%–0.94% | Impulze.ai | Influencer |
| Celebrity | 10M+ | 0.35% | HypeAuditor | Public Figure |
This is why small accounts can look much stronger on paper. As audiences get larger, engagement usually drops. That doesn’t always mean the content is worse. It just means the baseline shifts.
Format changes the baseline one more time.
Carousels lead feed engagement, Reels lead reach, and Stories support retention. According to Socialinsider, carousels average 0.55% engagement by followers, while Reels deliver 2.25 times the reach of single-image posts and a reach rate of 30.81%. Static images have seen a 30% drop in engagement since 2022 .
| Format | Engagement Rate (ERF) | Reach Rate | Source & Year | Metric |
|---|---|---|---|---|
| Carousels | 0.55% | 14.45% | Socialinsider / Rival IQ | Followers |
| Reels | 0.50%–0.52% | 30.81% | Socialinsider / Dash Social | Includes views and shares |
| Single Images | 0.35%–0.45% | 13.14% | Socialinsider / Colorlib | Reach |
| Stories | 5.4% | 2%–9% (Reach Rate) | Socialinsider | Includes sticker interactions |
A simple way to read this:
Think you're an expert on these numbers? Take an Instagram metrics knowledge quiz to test your skills. The next section explains why these benchmarks keep falling in 2026.
The lower 2026 averages point to a big change in how the Instagram algorithm distributes content. That’s why a lower like count doesn’t tell the whole story anymore.
In 2026, saves and shares carry much more weight than likes in Instagram’s distribution model. For Reels, watch time and completion rates now matter more than hashtags.
The behavior data backs that up. Instagram shares per post grew 12% year-over-year, while public comments fell 16%. People are still interacting with content. They’re just doing more of it in private through saves, shares, and DMs instead of public likes and comments.
Put simply, the pecking order is Saves > Shares > Comments > Likes. So if a post gets saved or shared, it tends to matter more than a post that only gets a quick tap.
Once you know what Instagram rewards, the next move is to compare your results with the right group.
To judge performance the right way, compare accounts in this order: industry → follower tier → format → formula.
A rate that looks low next to the platform average may still be normal for your industry and follower count. If you want to judge content quality, reach-based engagement is the better signal. If you want competitive benchmarking, follower-based engagement is the standard. You can use the Instagram engagement rate calculator to check your numbers using the right denominator.
The big takeaway is straightforward: engagement is falling, but context matters more than raw averages. The benchmark that matters is the one that matches your industry, follower tier, and format.
And underneath all of that, audience quality matters more than audience size. Real, well-targeted followers keep the engagement ratios these benchmarks reward. UpGrow's AI targeting and human IG experts are built around audience fit, so a free trial is a practical way to see whether your current audience mix is dragging down engagement.
Last updated: June 2026
In 2026, Instagram engagement refers to the actions people take on a post, mainly likes, comments, shares, and saves.
Likes still matter, but saves, shares, and comments now send a stronger signal about how a post is doing. That’s why some marketers still measure engagement based on follower count, while others use reach to get a better sense of feed performance.
It depends on what you're trying to measure.
Follower-based engagement works best when you want to compare your account with peers, because follower counts are public. That said, this rate often drops as an account gets bigger.
Reach-based engagement is better for judging how a post did with the people who actually saw it. It filters out inactive followers, but it's tougher to compare across accounts because reach data is private.
Recalculate it with rolling 30-, 60-, and 90-day windows to build a steady baseline. That gives you a much clearer read than judging one post or relying on a single isolated calculation.
Use a sample of at least 30 posts so the data means something. With that many posts, it’s easier to spot actual performance shifts and compare results with benchmarks and your past performance.
Share this post&description=Engagement%20on%20Instagram%20dropped%20in%202026%3B%20benchmark%20performance%20varies%20by%20industry%2C%20follower%20size%2C%20format%2C%20and%20calculation%20method.&image=https://www.upgrow.com/blog-images/assets.seobotai.com/cdn-cgi/image/quality=75,w=1536,h=1024/upgrow.com/6a3b35ad2902db05ecd7d948-1782267552348.jpg)


