
Instagram Stories Statistics 2026: Completion Rates, Views & Engagement Benchmarks
Instagram Stories benchmarks for 2026: completion ~70%, reach by follower size, first-frame exits ~24%, and engagement targets.
Instagram Stories benchmarks for 2026: completion ~70%, reach by follower size, first-frame exits ~24%, and engagement targets.
4.98 /5 - from 58k reviews
Trusted by 50,000+ creators — get real engagement delivered to your profile in minutes, not days.

If you want the short answer: a good Instagram Stories completion rate in 2026 is about 70%. Small accounts can go above 90%, brand Stories often sit near 88.2%, and the first slide is where most viewers leave.
Here’s what I’d pay attention to right away:
In other words: if your Stories get seen by a small slice of followers, keep people watching past the first few slides, and pull replies or sticker taps, you’re in good shape.
A few points matter more than the rest:
One thing to keep in mind: these numbers don’t all come from the same method. Some studies track full-sequence completion, others look at single-frame viewing, and some use reach while others use impressions. So I’d treat these as working ranges, not fixed rules.
If I were benchmarking an account in 2026, I’d use this simple checklist:
| Metric | Good working range |
|---|---|
| Completion rate | 60%–70% |
| Strong completion rate | 70%–87% |
| Small-account completion | 90%+ |
| Reach rate | 3.5%–5.4% overall |
| Small-account reach | 9.5%–10.4% |
| Reply rate | 1%–3% of reach |
| Sticker interaction rate | 15%–25% of reach |
| Link sticker tap rate | about 1.2% average; 3%–8% is a good target |
The article breaks all of this down by account size, Story length, exits, tap behavior, replies, stickers, and sales impact - so you can compare your own numbers without getting lost in mixed definitions.
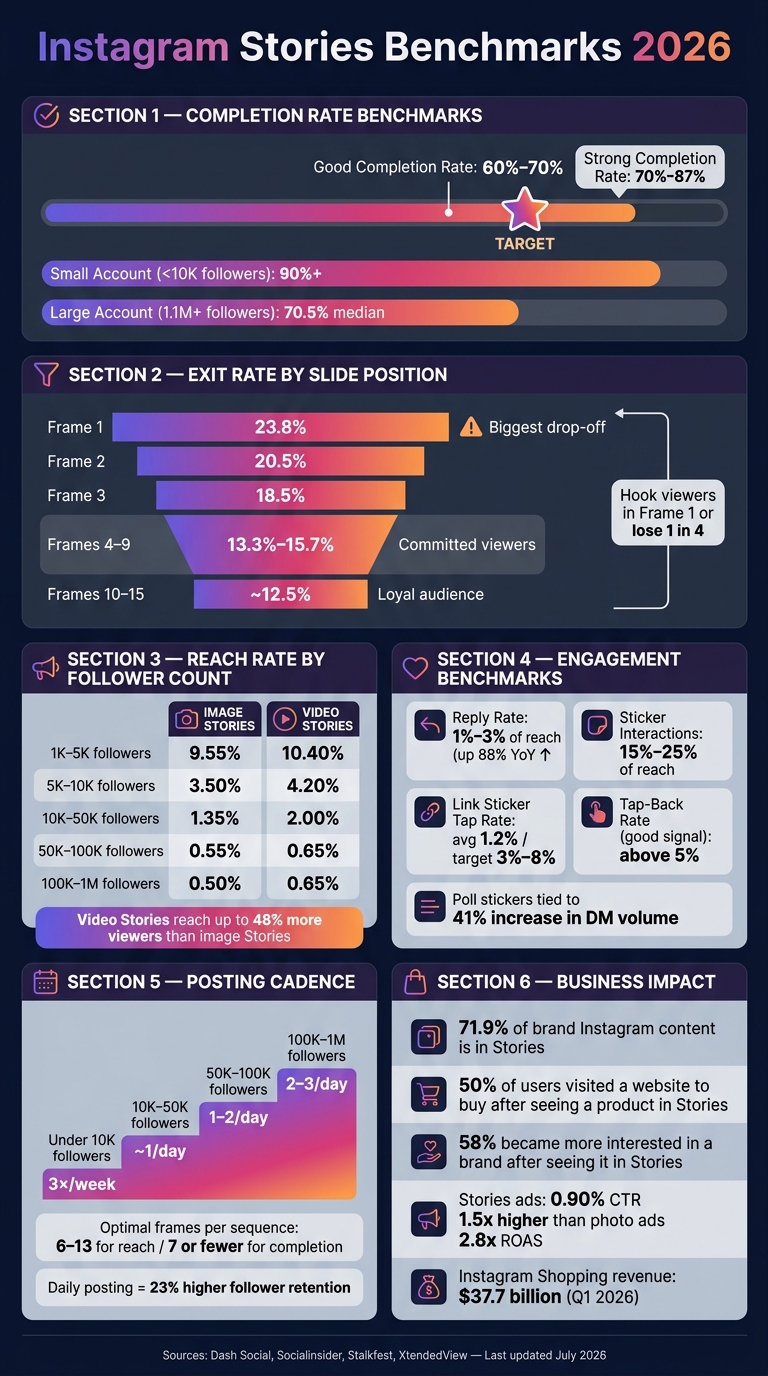
Instagram Stories Benchmarks 2026: Key Stats at a Glance
A good Instagram Stories completion rate in 2026 sits around 70%. That said, benchmark numbers shift depending on the study and the way completion is measured. It also helps to keep organic Story completion separate from ad Story completion because they’re not judged on the same scale.
A practical range to use is 60%–70% at the lower end of published benchmarks, while 70%–87% shows up as a stronger range across several studies.
After the overall benchmark, The next thing to look at is account size and other essential Instagram metrics.
Follower count does affect completion rate, but it doesn’t move in a perfectly straight line. Dash Social’s data, based on roughly 2,000 brand accounts, found that large accounts (1.1M+ followers) had the highest median completion rate at 70.5%. That compares with 69.3% for mid-sized accounts and 68.3% for smaller accounts.
At the same time, XtendedView reports that micro-accounts with fewer than 10,000 followers can post completion rates above 90%. That usually points to a smaller but more dialed-in audience.
| Follower Count | Median Completion Rate | Source |
|---|---|---|
| Small (up to 190K) | 68.3% | Dash Social |
| Mid-sized (190K–1.1M) | 69.3% | Dash Social |
| Large (1.1M+) | 70.5% | Dash Social |
| Micro-accounts (under 10K) | 90%+ | XtendedView |
These numbers come from different methods and account groups, so it’s better to treat them as directional ranges, not one neat ladder. Audience quality matters more than follower count by itself. If your followers care about what you post, they’re far more likely to stick through the full Story. That’s the kind of audience UpGrow is built to help creators grow.
Completion rate tells you how many people make it to the end. Exit rate tells you where they bail.
And the pattern is pretty clear: the biggest drop happens right at the start.
Nearly 1 in 4 viewers leaves on the first frame at 23.8%, and exit rates stay high on frames 2 and 3 at 20.5% and 18.5%. After that, retention settles into a steadier range of 13.3%–15.7% across frames 4–9.
| Frame Position | Average Exit Rate | What It Means |
|---|---|---|
| Frame 1 | 23.8% | Highest drop-off; your hook has to work here |
| Frame 2 | 20.5% | Still high loss; keep the momentum going |
| Frame 3 | 18.5% | Drop-off begins to level off |
| Frames 4–9 | 15.7%–13.3% | Stable window; these are your committed viewers |
| Frames 10–15 | ~12.5% | Loyal audience territory; slight fatigue starts to appear |
This curve matters a lot. A Story with average completion can still be doing well if it holds attention after those first few slides. In many cases, the early exits tell you more than the final completion number alone.
Completion rate tells you how long people stick around. Reach tells you how many people saw the Story in the first place. In 2026, Instagram Story reach is strongest for smaller accounts and falls fast as follower count goes up, based on Socialinsider's 2025 benchmark study. That’s why it helps to look at reach percentage first and then check raw viewer counts by account tier.
Instagram Story reach drops as accounts get bigger. Accounts with 1K–5K followers reach 9.55%–10.40% of followers, while accounts with 100K–1M reach just 0.50%–0.65%. At the same time, Dash Social found average reach of 1,064 unique accounts for small accounts, 4,701 for mid-sized accounts, and 43,107 for large accounts. So yes, the percentage gets smaller, but the total number of viewers still goes up.
In 2026, Stories are still aimed mostly at people who already follow you, not at broad discovery. So a lower reach rate doesn’t automatically mean something is wrong. It often just reflects how the format works. Some studies put average brand Story reach at around 15% of followers, while Dash Social reports a cross-industry average of 19,378 unique accounts. It makes more sense to treat those numbers as a range, not one fixed goal.
Follower count is the main driver of raw Story views, but posting consistency still affects how many of those possible viewers actually see your content.
In 2026, Story distribution still leans toward accounts people already interact with. Posting daily can help steady reach over a 2–4 week period. Accounts that post Stories every day see 23% higher follower retention than accounts posting fewer than three times per week.
Here’s how reach changes by follower tier. Video beats image Stories at every level:
| Follower Count | Reach Rate (Image Stories) | Reach Rate (Video Stories) |
|---|---|---|
| 1K – 5K | 9.55% | 10.40% |
| 5K – 10K | 3.50% | 4.20% |
| 10K – 50K | 1.35% | 2.00% |
| 50K – 100K | 0.55% | 0.65% |
| 100K – 1M | 0.50% | 0.65% |
(Source: Socialinsider 2025 Benchmark Study)
For mid-sized accounts in the 10K–50K range, video Stories reach 2.00% of followers versus 1.35% for image Stories. That works out to about a 48% edge for video. And if impressions are higher than reach, that can point to replays, which is a good quality signal.
Reach matters most when it comes from followers who are likely to watch and interact - which leads straight into the engagement benchmarks below.
After reach, Story engagement tells you whether people did anything after seeing your Story. Reach shows how many people saw it. Engagement shows what happened next.
Instagram Story engagement usually falls into two buckets: actions and navigation. Most analysts split active engagement - replies, sticker taps, link clicks, profile visits, and shares - from navigation behavior - tap-forward, tap-back, exits, and next-story swipes.
The standard formula social managers use in 2026 is:
(Replies + Sticker Interactions + Link Taps) ÷ Story Views
One thing trips people up: studies don't always use the same denominator. Per-follower rates come in lower than per-view rates - about 0.48% across industries. So before you compare numbers, check what the study is measuring against.
Story replies are up 88% year-over-year as of 2026. That's a big shift. It suggests Stories are doing less one-way broadcasting and more direct conversation.
The table below separates active engagement from navigation so it's easier to scan. Treat these as working benchmarks, not fixed goals, since the denominator can change the number.
| Metric | Median/Average Value | High-Performer Range | Source |
|---|---|---|---|
| Tap-Forward Rate (Images) | 56%–66% | Below 50% | Socialinsider |
| Tap-Forward Rate (Video) | 50%–62% | Below 45% | Socialinsider |
| Tap-Back Rate | ~4.5% of views | Above 5% | Dash Social |
| Reply Rate | 1%–3% of reach | Above 3% | Stalkfest |
| Sticker Interactions (polls, questions, quizzes) | 15%–25% of reach | Above 25% | Stalkfest |
| Link Sticker Taps | ~1.2% | 3%–8% of reach | Digital Applied / Stalkfest |
High tap-forward rates are normal. People tap fast on Stories. But when those taps happen early, that's often a sign of a weak opening, slow pacing, or too much text on screen. On the flip side, a high tap-back rate is usually good news - it means something was strong enough to make a viewer go back and watch again.
Sticker interactions matter more than passive views in 2026. Interactive stickers can help future visibility among people who already engage. Poll stickers are also tied to a 41% increase in DM volume. If your goal is link traffic, a working target is 3%–8%. In tuned branded campaigns, some Stories can hit 15%–25% click-through rates, but that's the top end, not the norm.
Those engagement patterns matter most when you decide how many Stories to post each day.
For most accounts, 2–3 Stories per day is a practical target.
That said, posting volume usually climbs as accounts grow. Socialinsider 2025–2026 data shows a pretty clear pattern: smaller accounts post less often, while larger accounts tend to post more often and stay in front of followers more consistently.
| Follower Count | Stories per Month | Daily Average |
|---|---|---|
| 1K – 5K | ~12 Stories/month | ~0.4 (3×/week) |
| 5K – 10K | ~17 Stories/month | ~0.5 (every 2 days) |
| 10K – 50K | ~35 Stories/month | ~1.1 (daily) |
| 50K – 100K | ~50 Stories/month | ~1.6 (1–2/day) |
| 100K – 1M | ~80 Stories/month | ~2.6 (2–3/day) |
When it comes to how many frames to include in one Story sequence, there’s a trade-off. If your main goal is reach, aim for 6–13 frames. If you care more about completion rate, keep it tighter at 7 frames or fewer.
Daily posting also seems to help keep people around. Accounts that post Stories every day see 23% higher follower retention than accounts posting fewer than three times per week. And placement in the Story bar isn’t random. Instagram reacts to engagement quality, so weak reply, tap, and watch signals can push your Stories farther back.
In plain English: consistency matters, and so does giving people a reason to keep watching.
Once you’ve got cadence dialed in, the next thing to ask is simple: do Stories still lead to business results in 2026?
Yes, they do.
Right now, 71.9% of brand content on Instagram appears in Stories. That alone tells you where brands are putting their attention. More important, users still take action after seeing products there. 50% of users report visiting a website to make a purchase after seeing a product in Stories, and 58% say they became more interested in a brand after seeing it there.
On the commerce side, Instagram Shopping now drives $37.7 billion in annual commerce revenue as of Q1 2026.
Paid Story placements still have muscle too. Stories ads reach more than 900 million users monthly and average 0.90% CTR. They also deliver a 1.5x higher CTR than photo ads and an average ROAS of 2.8x. For organic Stories, link sticker click rates average about 1.2%.
Of course, these numbers don’t come from posting at random. Watch-through rate and replies depend a lot on audience fit. UpGrow's AI targeting connects accounts with followers who fit their niche - the kind of audience that watches Stories through and interacts. You can dig deeper into how to track these signals in our Instagram Stories analytics.
Use these benchmarks as working targets, not hard rules. Results shift based on audience quality, content type, and how long each Story sequence runs.
No single benchmark fits every account. Track your own numbers over 30 to 60 days and look for patterns in retention, taps, replies, clicks, and sales. That’s how you figure out what “good” means for your audience and content mix.
Last updated: July 2026
A good Instagram Stories completion rate in 2026 is usually 70% to 87%, depending on the source and how the data was measured. As a simple benchmark, 70%+ tends to signal strong audience retention.
The numbers can shift based on account size. Large accounts often land around 70.5%, while smaller accounts are closer to 68.3%. There’s also an early drop-off problem: nearly 24% of viewers exit on the first frame. That’s why a strong opening and concise content matter so much - they help keep people from bailing right away.
There’s no one-size-fits-all rule here. The right daily volume comes down to your account size and what your performance data says.
As a general guide, smaller accounts often top out at 7–14 posts per week, while medium accounts tend to land around 14–30. For Stories, many brands hit a sweet spot at 2–5 per day.
The main thing to watch is audience drop-off. If exits and tap-forward rates start climbing, that’s usually a sign people are losing interest and you may be posting too much.
People usually tap away because of content fatigue, weak pacing, or a lack of instant relevance. A lot of exits happen right after the first slide, which tells you something simple: if the hook is weak or the setup feels unclear, viewers are gone fast.
Exits in the middle of a Story sequence often mean the content or flow just isn’t landing. The usual culprits are slow sections, filler, sequences that drag on too long, a format that doesn’t fit the message, and little to no interaction.
To cut down on exits, keep Stories tight, open with your strongest hook, and add interactive stickers when the sequence runs longer.
Reels consistently get more reach than Stories.
These days, Stories do a different job. They help you stay close to the people who already follow you and give them more reasons to keep paying attention. Reels, on the other hand, are now the main format for discovery and new audience growth.
Recent data points in the same direction: Reels tend to drive higher reach, more interactions, and stronger engagement than Stories and feed posts.
Share this post


